
Airppb Airppb

Top Air Index Monitoring Systems for Global Buyers

Time:2026-09-18 Author:Sophia
0%

Choosing the right Air Index Monitoring system is not a simple equipment purchase. It is a decision about public health, data quality, and operational trust. Global buyers must compare sensor accuracy, pollutant coverage, calibration methods, connectivity, maintenance, and reporting standards. A compact roadside unit may show particulate pollution within seconds. A fixed monitoring station may provide stronger validation over many years. Both can be useful. Neither is automatically best.

Dr. Maria Neira, Director of the World Health Organization’s Department of Environment, Climate Change and Health, has warned, “There is no safe level of air pollution.” Her statement gives this market a clear responsibility. Monitoring systems should help buyers identify pollution patterns, not merely display attractive dashboards. Reliable platforms combine particulate matter readings with gases such as nitrogen dioxide, ozone, and sulfur dioxide. They also record temperature, humidity, location, and instrument status. Small details matter.

No system is perfect.

Field experience shows that poor maintenance can weaken excellent hardware. Humidity can distort readings. Network interruptions can leave empty data periods. Calibration may also differ between regions, creating difficult comparisons. This guide examines leading Air Index Monitoring solutions for international buyers. It considers technical performance, certification evidence, lifecycle costs, installation demands, and after-sales support. The assessment remains practical, but it has limits. Product specifications may change, and real-world performance can vary by climate and deployment site. Buyers should verify current documentation, request sample datasets, and test systems under local conditions before making a final decision.
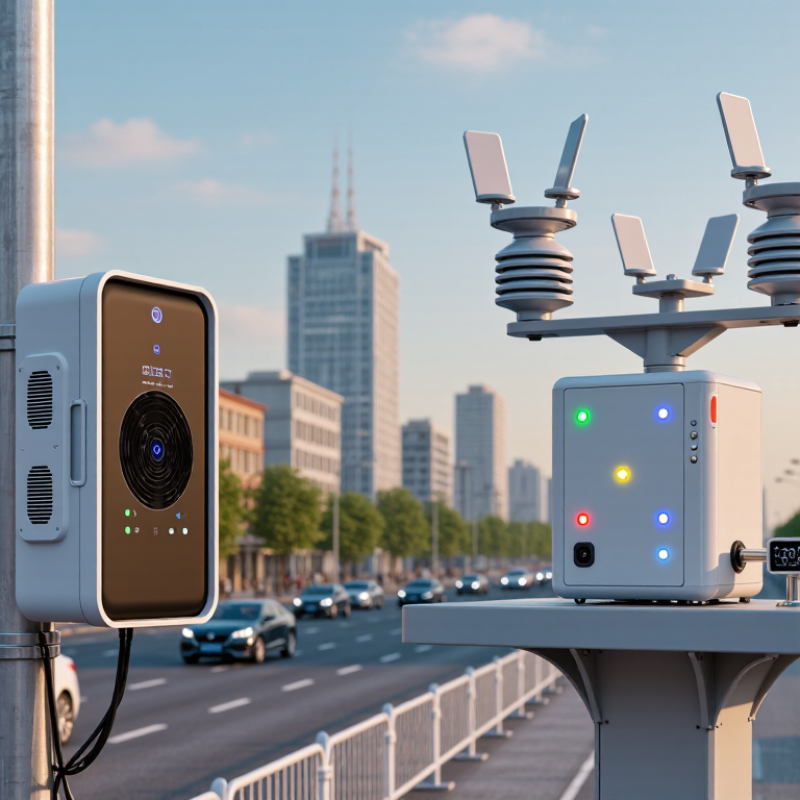
Top Air Index Monitoring Systems for Global Buyers

What Air Index Monitoring Systems Measure and Why They Matter

Air index monitoring systems convert pollutant concentrations into an understandable health signal. Most systems track PM2.5, PM10, ozone, nitrogen dioxide, sulfur dioxide, and carbon monoxide. They may also record temperature, humidity, wind, and pressure. These variables explain unusual readings. A roadside monitor can show a different picture from a rooftop station. Location matters.

The World Health Organization’s 2021 Air Quality Guidelines recommend annual PM2.5 exposure below 5 µg/m³. Its 24-hour guideline is 15 µg/m³. These are health-based references, not universal legal limits. AQI systems use local formulas, averaging periods, and color categories. Therefore, an “unhealthy” reading in one country may not match another. Short spikes can affect sensitive people, while long-term exposure increases risk. The Health Effects Institute’s State of Global Air 2024 estimated 8.1 million deaths were attributable to air pollution in 2021. Monitoring helps identify pollution patterns before visible haze appears.

Reliable deployment requires comparison with a reference-grade station, regular calibration, and humidity checks. Sensor drift is real. A polished dashboard can still be wrong. Buyers should examine detection limits, data completeness, timestamp accuracy, maintenance records, and alert latency. Field deployments often reveal gaps during traffic peaks, cooking periods, dust events, and rain. Monitoring measures uncertainty, too. That limitation deserves attention.

Core Technologies Used in Global Air Quality Monitoring

Top Air Index Monitoring Systems for Global Buyers

Core Technologies Used in Global Air Quality Monitoring

Modern air index monitoring systems combine several technologies, because no single sensor captures every pollutant reliably. Reference-grade analyzers measure particulate matter, nitrogen dioxide, ozone, sulfur dioxide, and carbon monoxide with controlled airflow and stable calibration. Optical particle counters estimate PM2.5 by measuring laser-scattered light. They are compact and useful for dense urban networks.

Electrochemical cells detect gases through electrical reactions at the sensing surface. Their performance can drift with humidity, temperature, and cross-sensitivity. Non-dispersive infrared technology offers stronger carbon monoxide measurement, while ultraviolet photometry supports ozone analysis. Field teams should record temperature and relative humidity beside every reading. Small details matter.

The World Health Organization reported that 99% of the global population breathed air exceeding its updated guideline levels in its 2022 air quality database. The State of Global Air 2024 report estimated 8.1 million deaths were attributable to air pollution in 2021. These figures show why data quality matters, not merely sensor quantity.

Satellite observations and lidar systems add regional visibility, especially where ground stations are sparse. However, they need surface measurements for validation. Practical networks use automated calibration checks, duplicate sensors, and regular maintenance visits. Low-cost monitors can expand coverage, but treating their output as perfect would be a mistake. Sensor correction models improve accuracy, yet they may fail during unusual weather or industrial episodes. Reliable systems therefore combine measurement, verification, and honest uncertainty reporting.

Top Air Index Monitoring Systems for Global Buyers

Core Technologies Used in Global Air Quality Monitoring

The chart compares selected World Health Organization 2021 air quality guideline concentrations. These reference values are commonly used when configuring air monitoring networks, indoor air sensors, roadside stations, and industrial emission systems.

Modern monitoring platforms typically combine optical particle counting for PM2.5 and PM10 with electrochemical, infrared, ultraviolet fluorescence, or chemiluminescence technologies for gaseous pollutants. Values shown are in µg/m³ and use the averaging periods specified by the WHO guideline.

Key Features of Leading Air Index Monitoring Systems

Leading air index monitoring systems combine accurate sensors, clear software, and dependable maintenance. They commonly measure PM2.5, PM10, ozone, nitrogen dioxide, carbon monoxide, temperature, and humidity. A useful system shows both raw readings and an understandable air quality index. Real-time updates matter during traffic peaks, construction, or sudden smoke events. However, fast data is not always accurate data.

Reliable systems include automatic calibration checks, sensor drift warnings, and stored measurement histories. They should support secure data transfer, remote access, and simple reports for technical teams. Weather-resistant housing is essential for outdoor stations, especially in humid or dusty locations. Placement also affects results. A sensor near an exhaust outlet may report a dramatic reading, but it may not represent the wider area. No system is perfect. Even advanced equipment needs periodic reference testing and careful cleaning.

Tips: Check the system’s measurement range before purchase. Ask how often calibration is required. Compare readings with an independent reference station when possible. Review the alert settings, because poorly chosen limits may create unnecessary concern. Keep a maintenance record with dates, weather conditions, and sensor replacements. Small details matter. Global buyers should also confirm local data standards, language support, power requirements, and connectivity options. A practical system is not always the most complex one; it is the one that produces trustworthy information in real operating conditions.

Top Air Index Monitoring Systems for Global Buyers - Key Features of Leading Air Index Monitoring Systems
System Category Primary Pollutants and Parameters Typical Measurement Technology Representative Measurement Range Data Interval Connectivity and Data Output Environmental Protection Typical Application
Reference-Grade Continuous Station PM2.5 PM10 O₃ NO₂ SO₂ CO
Temperature, relative humidity, wind speed and wind direction
Beta attenuation or equivalent reference-grade particulate measurement; UV photometry for ozone; chemiluminescence for nitrogen oxides; ultraviolet fluorescence for sulfur dioxide; non-dispersive infrared measurement for carbon monoxide. Commonly configured for PM2.5 and PM10 up to approximately 1,000 µg/m³; gas ranges are selected by pollutant and may commonly cover sub-ppm to several tens of ppm. Seconds to 1-minute raw data; 1-hour and 24-hour averages for regulatory reporting and AQI calculations. Industrial data logger, Ethernet, cellular modem, secure APIs, CSV export and standardized protocols such as Modbus or MQTT. Usually housed in a weatherproof enclosure with temperature control, filtered air inlets and automated fault alarms. National monitoring networks, regulatory compliance, urban background stations and long-term trend analysis.
Compact Outdoor Multi-Pollutant Node PM1 PM2.5 PM10 CO₂ TVOC
Optional CO, O₃, NO₂, temperature and humidity
Optical particle counting, NDIR carbon dioxide sensing and electrochemical or metal-oxide gas sensing. Particulate matter is commonly measured from 0 to 500 or 1,000 µg/m³; CO₂ commonly covers 400 to 5,000 ppm; gas ranges vary by sensor configuration. 1 to 5 minutes for routine network monitoring; shorter intervals may be available for local diagnostics. Wi-Fi, cellular, LoRaWAN or Ethernet; dashboard visualization, threshold alerts, downloadable records and API integration. Typically IP65 or higher when installed in a suitable outdoor enclosure; solar power and battery options are available. Neighborhood mapping, smart-city projects, construction monitoring and supplementary monitoring networks.
Indoor Air Quality Monitor PM2.5 CO₂ TVOC CO
Temperature, relative humidity, pressure and noise may also be included
Optical particle sensing, NDIR CO₂ measurement, metal-oxide or photoionization-based VOC sensing, and electrochemical carbon monoxide sensing. PM2.5 commonly 0 to 500 µg/m³; CO₂ commonly 400 to 5,000 ppm; TVOC ranges are sensor-dependent and are generally reported as an indicative concentration. 10 seconds to 5 minutes, with configurable averaging for ventilation control and occupant alerts. Wi-Fi, Bluetooth, Ethernet or local display; BACnet, Modbus or API integration may be supported for building-management systems. Designed for indoor use; many units operate best at approximately 0 to 40°C and 10% to 90% relative humidity without condensation. Schools, offices, healthcare facilities, homes, hotels and demand-controlled ventilation systems.
Portable Handheld Air Monitor PM2.5 PM10 CO₂ VOC
Optional carbon monoxide, ozone or nitrogen dioxide
Battery-powered optical particle sensor combined with NDIR, electrochemical or VOC sensor modules. Often configured for particulate matter from 0 to 500 µg/m³ and CO₂ from 400 to 5,000 ppm; portable gas ranges depend on the installed module. 1 second to 1 minute for field surveys, with rolling averages used to reduce short-term measurement noise. Local screen, Bluetooth, USB or mobile application; GPS tagging may be available for route-based surveys. Usually splash-resistant rather than fully weatherproof; operating temperature commonly falls within approximately 0 to 40°C. Indoor inspections, workplace surveys, personal exposure studies, commissioning and troubleshooting.
Vehicle-Mounted Mobile Monitoring System PM1 PM2.5 PM10 CO₂ NO₂
Optional CO, O₃, black carbon and meteorological parameters
Fast-response optical particle counting, electrochemical or optical gas sensors, GPS and vehicle-speed data integration. Common particulate range: 0 to 1,000 µg/m³; gas ranges are selected for roadside, industrial or community monitoring requirements. 1 second to 1 minute, synchronized with GPS coordinates and route information. Onboard storage, cellular transmission, GPS, GIS-compatible files and time-stamped spatial data. Protected instrument enclosure with vibration management, controlled airflow and inlet positioning suited to moving platforms. Roadside pollution mapping, environmental-impact assessment, hotspot identification and emergency response.
Industrial Fence-Line Monitoring System PM2.5 PM10 VOC H₂S NH₃
Other gases selected according to the industrial process
Optical particulate sensors, electrochemical cells, photoionization detectors, infrared sensors or open-path optical systems. Particulate matter commonly 0 to 1,000 µg/m³; gas detection ranges are selected from low-ppb community levels to ppm-level process or incident monitoring. 1 second to 15 minutes, depending on the pollutant, alarm requirements and reporting protocol. Cellular, private radio, Ethernet or mesh networking; real-time alarms, geofencing, event logs and compliance reports. Outdoor-rated enclosure, corrosion-resistant components and optional hazardous-area protection where required by site classification. Industrial perimeter monitoring, odor investigations, chemical facilities, waste sites and emergency notification.
Solar-Powered Remote Monitoring Station PM2.5 PM10 O₃ NO₂
Temperature, humidity, rainfall and wind measurements
Low-power optical particulate and gas sensors with solar charging, battery storage and remote diagnostics. Particulate matter commonly 0 to 500 or 1,000 µg/m³; gas measurement ranges depend on the selected sensor and local air-quality objectives. 1 to 15 minutes, with local buffering during communication outages. Cellular, LoRaWAN or satellite communication; cloud dashboard, alarm rules, device-health reporting and remote firmware updates. Weatherproof enclosure, solar panel, rechargeable battery, surge protection and low-power operating modes. Rural areas, ports, highways, mining sites, agricultural regions and locations without reliable grid power.
AQI Calculation and Data Management Platform PM2.5 PM10 O₃ NO₂ SO₂ CO
Optional meteorological and calibration data
Data validation, time averaging, sensor correction, quality-control rules and jurisdiction-specific AQI breakpoint calculations. Accepts concentration data in commonly used units such as µg/m³, ppm or ppb; conversion and averaging rules must match the selected regulatory framework. Near real time to hourly; daily summaries and historical trend reports are also commonly provided. Web dashboard, mobile alerts, REST API, CSV or JSON export, role-based access and GIS visualization. Cloud or on-premise deployment with encrypted transmission, backup, audit logs and device-status monitoring. Multi-site networks, public information portals, environmental reporting and centralized fleet management.

Note: The ranges and capabilities shown are representative specifications for common system configurations. Actual performance depends on sensor selection, calibration, environmental conditions, installation, maintenance and the applicable national or regional air-quality standard. AQI values should be calculated using the official breakpoint table required in the target market.

How to Compare Systems for Different Global Applications

Comparing air index monitoring systems starts with the application, not the screen or dashboard. A roadside station needs rugged particulate and nitrogen dioxide measurements, while a school may need quieter, lower-cost sensors for classrooms. Outdoor systems face rain, dust, heat, and unstable power. Indoor systems face cooking peaks, cleaning chemicals, and changing occupancy.

Data quality matters more than a polished interface. The WHO 2021 Global Air Quality Guidelines set an annual PM2.5 guideline of 5 µg/m³, far below many local regulatory limits. A system should therefore record raw concentrations, calibration history, humidity, and missing data. An AQI number alone can hide important differences. AQI formulas and breakpoints vary between countries, so global buyers should confirm how each platform converts measurements into public health categories.

The State of Global Air 2024 report estimated 8.1 million deaths were linked to air pollution in 2021. That scale demands traceable evidence, not attractive charts. Reference-grade instruments offer stronger accuracy, but calibrated optical sensors can support dense networks when properly colocated and maintained. Field experience suggests checking sensors beside a trusted station before deployment, then repeating verification after severe weather. This step is often skipped. It should not be. Communication range, cybersecurity, repair access, and local technical training also deserve comparison. A system that loses data during a power cut is not globally ready, however advanced its analytics appear.

Installation, Data Management, and Regulatory Considerations

Installing an air index monitoring system begins with the site, not the software. Place sensors away from exhaust vents, walls, and direct rain. Record height, airflow conditions, nearby construction, and the exact installation time. Field work gets messy. Heat, dust, and unstable power can distort readings. Use protective housing, surge protection, and a maintenance plan suited to the location. Calibration checks should follow the manufacturer’s method and local monitoring requirements. Skipping one check may weaken an entire month of data.

Ownership matters. Store raw measurements separately from corrected values, with timestamps, unit definitions, and documented quality flags. An audit trail should show who changed a record and why. Use encrypted transfers and role-based access, especially when systems connect to public networks. Do not treat a colorful dashboard as evidence of compliance. Visuals help. Regulatory decisions usually depend on approved methods, reporting intervals, uncertainty estimates, and retention periods. Requirements differ across jurisdictions, so global buyers should map each site to its responsible authority before purchase. Local language support can prevent a small reporting error from becoming a costly delay.

Practical evaluation should include a live installation test, not only a product demonstration. Ask how the system behaves during sensor drift, network loss, and power interruption. A backup battery helps, but it does not replace recovery procedures. Test alarms with a controlled event and confirm that staff receive them. No deployment is perfect. A missed maintenance visit can expose weak planning. Review performance with an independent technical specialist when measurement results affect public reporting or operational decisions.

FAQS

What pollutants do air index monitoring systems usually measure?

They commonly measure PM2.5, PM10, ozone, nitrogen dioxide, sulfur dioxide, and carbon monoxide. Some systems also record temperature, humidity, wind, and pressure. These extra readings help explain unusual pollution values. Location matters.

Why can two nearby monitors show different readings?

A roadside sensor may detect traffic emissions more strongly than a rooftop station. Walls, exhaust vents, airflow, rain, and nearby construction can change results. Even a short distance matters. We should not assume both devices describe identical exposure.

What do air quality guidelines mean?

Health-based guidelines provide reference levels, not universal legal limits. One framework recommends annual PM2.5 below 5 µg/m³ and a 24-hour level of 15 µg/m³. Local index formulas and averaging periods can differ. An “unhealthy” category may not mean the same thing everywhere.

Can short pollution spikes affect people?

Yes. Short spikes may trouble sensitive people, including those with breathing conditions. Long-term exposure can increase health risks. Monitoring can reveal traffic peaks, cooking periods, dust events, and pollution before visible haze appears. The alert may arrive late.

How can buyers judge monitoring system reliability?

Compare the system with a reference-grade station. Check detection limits, data completeness, timestamps, calibration records, and alert latency. Review humidity performance and sensor drift. A polished dashboard can still be wrong. Sensors drift.

Where should air sensors be installed?

Choose a representative location away from exhaust vents, walls, and direct rain. Record sensor height, airflow, nearby construction, and installation time. Protective housing and surge protection may help. Heat, dust, and unstable power remain practical problems. Field work gets messy.

What data should an air monitoring system preserve?

Store raw measurements separately from corrected values. Keep timestamps, units, quality flags, and maintenance records. An audit trail should identify who changed data and why. Use encrypted transfers and role-based access for networked systems. Data ownership is easy to overlook.

What should be tested before deployment?

Run a live installation test, not only a demonstration. Simulate network loss, power interruption, sensor drift, and a controlled alarm event. Confirm that staff receive alerts and recovery procedures work. A backup battery helps. It does not solve weak planning.

Conclusion

Air Index Monitoring systems help global buyers understand the condition of the air by measuring pollutants and environmental factors such as particulate matter, ozone, nitrogen compounds, carbon monoxide, temperature, and humidity. These measurements support public health planning, workplace safety, industrial management, and environmental protection. Modern systems may combine optical particle sensors, gas detection technologies, weather instruments, automated calibration, and connected data platforms to deliver timely and reliable information.

When comparing Air Index Monitoring solutions, buyers should consider measurement accuracy, detection range, response time, durability, power requirements, communication options, data security, and ease of maintenance. Different applications may require fixed stations, portable units, or networked monitoring devices. Installation conditions, sensor placement, calibration schedules, data storage, reporting functions, and regional regulatory requirements are also essential. A well-selected system should provide consistent data, clear air-quality indicators, flexible integration, and practical long-term support for diverse global operating environments.

Sophia

Sophia

Sophia is a dedicated marketing professional with an exceptional depth of knowledge about her company's products and services. With a keen understanding of market trends and customer needs, she crafts insightful blog posts that not only inform but also engage readers, enriching the company’s online......